


LEAGUES
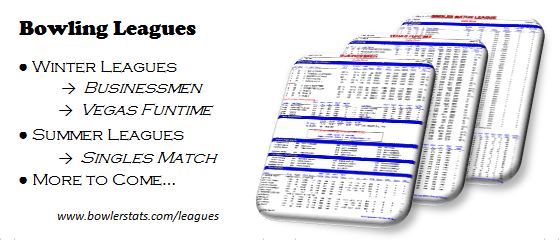
FALL LEAGUES
- BUSINESSMEN (Tues)
- VEGAS FUNTIME (Weds)
- RENO LEAGUE (Tues)
SUMMER LEAGUES
- SINGLES MATCH LEAGUE (Tues) – Currently not an active league…
- TNT TEAM CHALLENGE (Weds) – Currently not an active league…
Is there a league you would like bowlerstats.com to cover?
Let let the guy from accounting know…
BOWLING CENTER
Delta Bowl
3300 Delta Fair Blvd.
Antioch, CA 94509
925-757-5424
www.deltabowl.net
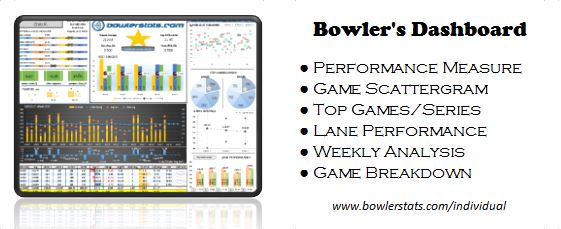
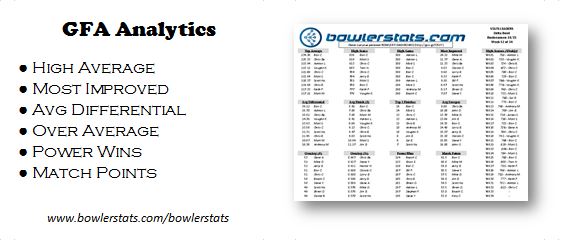
GFA Analytics
All bowler data and statistics on bowlerstats.com are derived from the weekly league sheet. Underneath “LEAGUES” on the menu bar you will find different league names:
Under each corresponding league name, there are various reports, analysis, and information specific to that league. Each league may be different depending on the league type, format, etc. Below you will find the explanation and examples on what is offered on bowlerstats.com.
League Sheets – Weekly standings, scores, and stats from last week
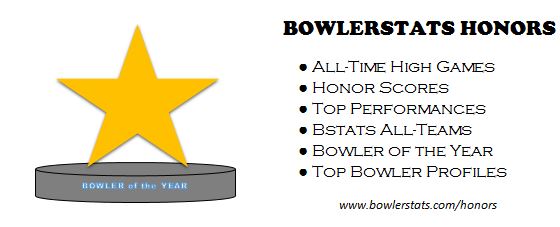
Top Performances – Top Game and Top Series of the Week
All Bowlers – Stats summary for all league bowlers (sorted by average)
Power Standings – Series w/handicap versus All bowlers
How does your score with handicap stand-up against everybody bowling during league night (the field)?
For every series with handicap, where your score is higher, you receive 1 win (W). If your score is lower, you receive 1 lost (L). If the score is equal, your receive a tie (T). The use of handicap in the calculation, it equalizes the scores for comparison. Throughout the season, the following statistical categories will be tracked:
- # of Wins (overall)
- # of Undefeated (overall)
- Weekly Record (league night)
- Weekly Win% (league night)
- Season Record (overall)
- Season Win% (overall)
Example:
| BOWLER A | Opponents | ||||
| Average | 194 | BOWLER B | 658 | W | |
| Handicap | 16 | BOWLER C | 725 | L | |
| Handicap total | 48 | BOWLER D | 677 | T | |
| Game 1 | 207 | BOWLER E | 639 | W | |
| Game 2 | 225 | ||||
| Game 3 | 197 | ||||
| Series | 629 | Record | 2-1-1 | ||
| Series w/hdcp | 677 | Win % | 62.50% | ||
What does Power Standings tell me?
It tells you how powerful and dominate your series was for the week. Since most bowling tournaments are handicap based, doing well in this category best simulates a top bowling tournament finish or win.
How to use Power Standings?
fghfghdfhgdfhdfh
Average Differential – Average for the night versus the Field Average
Finishes – Top 1, Top 5, Top 10, Top 20 series for the week
Over Average – # of games bowled over average / % games bowled over average
High Games & Series – Top games and series for the season
Most Improvement – Bowler with the most improvement from 21 games
Rules & Details – League rules, formats, points, payouts, and other details.
TIPS & TOOLS

Here are few Tips & Tools that may help your bowling game. Many have been recommended by friends or just stumbled across them on the web. Hope you enjoy!
Apr 28
Businessmen – Week 32 Results
| BOWLERSTATS.COM – Businessmen’s League (Week 32) | ||||||
| League Sheet | League Details | BOWLERS | ||||
| Top Scores | League Sheet Stats | Stats Leaders | ||||
| Top Bowlers | Top Performances | Power Standings | ||||
| Individual Stats | Honor Scores | Most Improved | ||||
TOP 3 – Games/Series
| GAMES | 1 | 278 – Don C. | 2 | 258 – Robert W. | 3 | 257 – Carl M. |
| SERIES | 1 | 720 – Mike D. | 2 | 702 – Ashton L. | 3 | 691 – Robert C. |
TOP 10 – Week 32
| Place | Bowler | Average | Team Name | Game 1 | Game 2 | Game 3 | Series |
| 1 | Mike D. | 210.83 | 5 – BIG “O” TIRES | 247 | 238 | 235 | 720 |
| 2 | Ashton L. | 223.99 | 3 – BALLZ DEEP | 233 | 223 | 246 | 702 |
| 3 | Robert W. | 198.99 | 3 – BALLZ DEEP | 187 | 246 | 258 | 691 |
| 4 | Ron C. | 238.60 | 5 – BIG “O” TIRES | 192 | 235 | 247 | 674 |
| 5 | Gene A. | 209.04 | 2 – Team 2 | 187 | 223 | 238 | 648 |
| 5 | Jocko M. | 197.86 | 2 – Team 2 | 191 | 253 | 204 | 648 |
| 7 | Aristotle S. | 198.75 | 1 – HELP NEEDED PLEASE! | 189 | 222 | 234 | 645 |
| 8 | Kenny N. | 194.86 | 4 – T-N-T PRO SHOP | 245 | 207 | 192 | 644 |
| 9 | Jim B. | 211.84 | 7 – Team 7 | 268 | 176 | 191 | 635 |
| 10 | David M R. | 191.78 | 8 – DELTA TRANSMISSION | 232 | 226 | 175 | 633 |
Apr 19
Businessmen – Week 31 Results
| BOWLERSTATS.COM – Businessmen’s League (Week 31) | ||||||
| League Sheet | League Details | BOWLERS | ||||
| Top Scores | League Sheet Stats | Stats Leaders | ||||
| Top Bowlers | Top Performances | Power Standings | ||||
| Individual Stats | Honor Scores | Most Improved | ||||
TOP 3 – Games/Series
| GAMES | 1 | 278 – Don C. | 2 | 277 – Dustin T. | 3 | 269 – Vaughn K. |
| SERIES | 1 | 760 – Chris C. | 2 | 736 – Vaughn K.. | 3 | 628 – Ron C. |
TOP 10 – Week 31
| Place | Bowler | Average | Team Name | Game 1 | Game 2 | Game 3 | Series |
| 1 | Chris C. | 217.08 | 4 – T-N-T PRO SHOP | 267 | 256 | 237 | 760 |
| 2 | Vaughn K. | 221.00 | 5 – BIG “O” TIRES | 220 | 269 | 247 | 736 |
| 3 | Ron C. | 238.47 | 5 – BIG “O” TIRES | 258 | 227 | 243 | 728 |
| 4 | Gizmo S. | 196.28 | 3 – BALLZ DEEP | 246 | 264 | 208 | 718 |
| 5 | Ashton L. | 223.55 | 3 – BALLZ DEEP | 216 | 247 | 247 | 710 |
| 6 | Chris R. | 209.09 | 1 – HELP NEEDED PLEASE! | 214 | 223 | 267 | 704 |
| 7 | Carl M. | 196.43 | 3 – BALLZ DEEP | 243 | 248 | 210 | 701 |
| 8 | John H. | 207.76 | 1 – HELP NEEDED PLEASE! | 200 | 242 | 258 | 700 |
| 9 | Mike D. | 210.01 | 5 – BIG “O” TIRES | 206 | 246 | 244 | 696 |
| 10 | Don C. | 211.34 | 10 – Team 10 | 278 | 181 | 235 | 694 |
Apr 14
Businessmen – Week 30 Results
| BOWLERSTATS.COM – Businessmen’s League (Week 30) | ||||||
| League Sheet | League Details | BOWLERS | ||||
| Top Scores | League Sheet Stats | Stats Leaders | ||||
| Top Bowlers | Top Performances | Power Standings | ||||
| Individual Stats | Honor Scores | Most Improved | ||||
TOP 3 – Games/Series
| GAMES | 1 | 259 – Don C. | 2 | 258 – Ashton L. | 3 | 256 – Kenny F. |
| SERIES | 1 | 723 – Ashton L. | 2 | 701 – Kenny F. | 3 | 688 – Don C. |
TOP 10 – Week 30
| Place | Bowler | Average | Team Name | Game 1 | Game 2 | Game 3 | Series |
| 1 | Ashton L. | 222.93 | 3 – BALLZ DEEP | 227 | 238 | 258 | 723 |
| 2 | Kenny F. | 213.07 | 10 – Team 10 | 256 | 213 | 232 | 701 |
| 3 | Don C. | 210.70 | 10 – Team 10 | 232 | 259 | 197 | 688 |
| 4 | James S. | 213.42 | 11 – DELTA BOWL | 216 | 230 | 238 | 684 |
| 5 | Sal B. | 234.23 | S – Team Sub | 203 | 254 | 223 | 680 |
| 5 | Stan S. | 209.68 | 7 – Team 7 | 213 | 237 | 230 | 680 |
| 7 | Chris Be. | 191.33 | S – Team Sub | 248 | 227 | 204 | 679 |
| 8 | Chris C. | 216.82 | 4 – T-N-T PRO SHOP | 237 | 192 | 244 | 673 |
| 9 | Tom H. | 213.87 | 4 – T-N-T PRO SHOP | 220 | 225 | 225 | 670 |
| 10 | Kent W. | 200.38 | 12 – Team 12 | 205 | 218 | 245 | 668 |
Mar 28
Businessmen – Week 28 Results
| BOWLERSTATS.COM – Businessmen’s League (Week 28) | ||||||
| League Sheet | League Details | BOWLERS | ||||
| Top Scores | League Sheet Stats | Stats Leaders | ||||
| Top Bowlers | Top Performances | Power Standings | ||||
| Individual Stats | Honor Scores | Most Improved | ||||
TOP 3 – Games/Series
| GAMES | 1 | 274 – Tom H. | 2 | 268 – Ron C. | 3 | 268 – Daniel R. |
| SERIES | 1 | 739 – Ron C. | 2 | 735 – Mike D. | 3 | 728 – Ashton L. |
TOP 10 – Week 28
| Place | Bowler | Average | Team Name | Game 1 | Game 2 | Game 3 | Series |
| 1 | Ron C. | 239.65 | 5 – BIG “O” TIRES | 268 | 246 | 225 | 739 |
| 2 | Mike D. | 208.83 | 5 – BIG “O” TIRES | 227 | 255 | 253 | 735 |
| 3 | Ashton L. | 223.27 | 3 – BALLZ DEEP | 233 | 244 | 214 | 691 |
| 4 | Jerry N. | 197.63 | S – Team Sub | 232 | 220 | 207 | 659 |
| 5 | Tom H. | 214.62 | 4 – T-N-T PRO SHOP | 274 | 171 | 212 | 657 |
| 6 | Kenny F. | 214.28 | 10 – Team 10 | 224 | 246 | 180 | 650 |
| 7 | Sal B. | 235.85 | S – Team Sub | 206 | 219 | 224 | 649 |
| 8 | Steve Y. | 187.52 | 1 – HELP NEEDED PLEASE! | 204 | 242 | 195 | 641 |
| 9 | David M R. | 190.47 | 8 – DELTA TRANSMISSION | 232 | 225 | 182 | 639 |
| 10 | Gizmo S. | 195.15 | 3 – BALLZ DEEP | 201 | 208 | 222 | 631 |
Mar 22
Businessmen – Week 27 Results
| BOWLERSTATS.COM – Businessmen’s League (Week 27) | ||||||
| League Sheet | League Details | BOWLERS | ||||
| Top Scores | League Sheet Stats | Stats Leaders | ||||
| Top Bowlers | Top Performances | Power Standings | ||||
| Individual Stats | Honor Scores | Most Improved | ||||
TOP 3 – Games/Series
| GAMES | 1 | 299 – Ron C. | 2 | 280 – Ron C. | 3 | 279 – Gene A. |
| SERIES | 1 | 775 – Ron C. | 2 | 736 – Gene A. | 3 | 728 – Sal B. |
TOP 10 – Week 27
| Place | Bowler | Average | Team Name | Game 1 | Game 2 | Game 3 | Series |
| 1 | Ron C. | 238.94 | 5 – BIG “O” TIRES | 299 | 196 | 280 | 775 |
| 2 | Gene A. | 209.87 | 2 – Team 2 | 213 | 279 | 244 | 736 |
| 3 | Sal B. | 235.17 | S – Team Sub | 257 | 224 | 247 | 728 |
| 4 | Mark M. | 219.56 | 12 – Team 12 | 237 | 217 | 222 | 676 |
| 5 | Tom H. | 214.29 | 4 – T-N-T PRO SHOP | 235 | 230 | 204 | 669 |
| 6 | Gizmo S. | 194.45 | 3 – BALLZ DEEP | 216 | 210 | 212 | 638 |
| 7 | Stan S. | 210.88 | 7 – Team 7 | 225 | 192 | 217 | 634 |
| 8 | David M R. | 189.67 | 8 – DELTA TRANSMISSION | 236 | 195 | 201 | 632 |
| 9 | Don C. | 210.24 | 10 – Team 10 | 236 | 234 | 161 | 631 |
| 10 | Kent W. | 200.69 | 12 – Team 12 | 212 | 214 | 204 | 630 |
Mar 15
Businessmen – Week 26 Results
| BOWLERSTATS.COM – Businessmen’s League (Week 26) | ||||||
| League Sheet | League Details | BOWLERS | ||||
| Top Scores | League Sheet Stats | Stats Leaders | ||||
| Top Bowlers | Top Performances | Power Standings | ||||
| Individual Stats | Honor Scores | Most Improved | ||||
TOP 3 – Games/Series
| GAMES | 1 | 278 – Ron C. | 2 | 275 – Kenny N. | 3 | 268 – Gene A. |
| SERIES | 1 | 764 – Ron C. | 2 | 760 – Gene A. | 3 | 759 – Roach C. |
TOP 10 – Week 26
| Place | Bowler | Average | Team Name | Game 1 | Game 2 | Game 3 | Series |
| 1 | Ron C. | 238.31 | 5 – BIG “O” TIRES | 248 | 238 | 278 | 764 |
| 2 | Gene A. | 208.06 | 2 – Team 2 | 226 | 268 | 266 | 760 |
| 3 | Kacy C. | 203.59 | 11 – DELTA BOWL | 258 | 236 | 265 | 759 |
| 4 | Jim B. | 212.87 | 7 – Team 7 | 248 | 245 | 214 | 707 |
| 5 | Don C. | 209.50 | 10 – Team 10 | 267 | 203 | 214 | 684 |
| 6 | Tom H. | 213.89 | 4 – T-N-T PRO SHOP | 224 | 213 | 236 | 673 |
| 7 | Stan S. | 210.50 | 7 – Team 7 | 223 | 212 | 225 | 660 |
| 8 | Carl M. | 195.46 | 3 – BALLZ DEEP | 234 | 192 | 233 | 659 |
| 9 | Mark M. | 219.63 | 12 – Team 12 | 248 | 235 | 171 | 654 |
| 10 | Ashton L. | 224.92 | 3 – BALLZ DEEP | 174 | 235 | 236 | 645 |
Mar 09
Businessmen – Week 25 Results
| BOWLERSTATS.COM – Businessmen’s League (Week 25) | ||||||
| League Sheet | League Details | BOWLERS | ||||
| Top Scores | League Sheet Stats | Stats Leaders | ||||
| Top Bowlers | Top Performances | Power Standings | ||||
| Individual Stats | Honor Scores | Most Improved | ||||
TOP 3 – Games/Series
| GAMES | 1 | 277 – Ron C. | 2 | 275 – David R. | 3 | 269 – Kacy C. |
| SERIES | 1 | 739 – Chris C. | 2 | 730 – David M R. | 3 | 716 – Ron C. |
TOP 10 – Week 25
| Place | Bowler | Average | Team Name | Game 1 | Game 2 | Game 3 | Series |
| 1 | Chris C. | 217.54 | 4 – T-N-T PRO SHOP | 246 | 236 | 257 | 739 |
| 2 | David M R. | 186.55 | 8 – DELTA TRANSMISSION | 235 | 267 | 228 | 730 |
| 3 | Ron C. | 238.29 | 5 – BIG “O” TIRES | 277 | 224 | 215 | 716 |
| 4 | Kacy C. | 202.36 | 11 – DELTA BOWL | 269 | 201 | 229 | 699 |
| 5 | Tom H. | 213.13 | 4 – T-N-T PRO SHOP | 237 | 217 | 243 | 697 |
| 6 | Mark M. | 219.40 | 12 – Team 12 | 213 | 247 | 213 | 673 |
| 7 | James S. | 214.22 | 11 – DELTA BOWL | 229 | 223 | 204 | 656 |
| 8 | Ashton L. | 225.30 | 3 – BALLZ DEEP | 228 | 203 | 217 | 648 |
| 9 | Jim B. | 212.75 | 7 – Team 7 | 184 | 259 | 202 | 645 |
| 9 | Kenny N. | 196.30 | 4 – T-N-T PRO SHOP | 199 | 214 | 232 | 645 |
A GFA Production…
