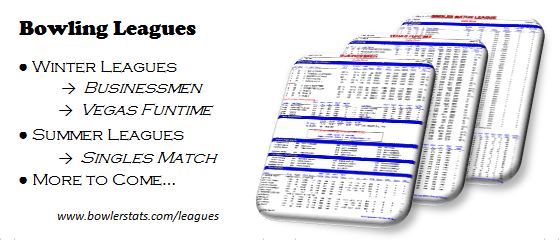
All bowler data and statistics on bowlerstats.com are derived from the weekly league sheet. Underneath “LEAGUES” on the menu bar you will find different league names:
Under each corresponding league name, there are various reports, analysis, and information specific to that league. Each league may be different depending on the league type, format, etc. Below you will find the explanation and examples on what is offered on bowlerstats.com.
League Sheets – Weekly standings, scores, and stats from last week
Top Performances – Top Game and Top Series of the Week
All Bowlers – Stats summary for all league bowlers (sorted by average)
Power Standings – Series w/handicap versus All bowlers
How does your score with handicap stand-up against everybody bowling during league night (the field)?
For every series with handicap, where your score is higher, you receive 1 win (W). If your score is lower, you receive 1 lost (L). If the score is equal, your receive a tie (T). The use of handicap in the calculation, it equalizes the scores for comparison. Throughout the season, the following statistical categories will be tracked:
- # of Wins (overall)
- # of Undefeated (overall)
- Weekly Record (league night)
- Weekly Win% (league night)
- Season Record (overall)
- Season Win% (overall)
Example:
| BOWLER A |
|
Opponents |
| Average |
194 |
|
BOWLER B |
658 |
W |
| Handicap |
16 |
|
BOWLER C |
725 |
L |
| Handicap total |
48 |
|
BOWLER D |
677 |
T |
| Game 1 |
207 |
|
BOWLER E |
639 |
W |
| Game 2 |
225 |
|
|
|
|
| Game 3 |
197 |
|
|
|
|
| Series |
629 |
|
Record |
2-1-1 |
|
| Series w/hdcp |
677 |
|
Win % |
62.50% |
|
What does Power Standings tell me?
It tells you how powerful and dominate your series was for the week. Since most bowling tournaments are handicap based, doing well in this category best simulates a top bowling tournament finish or win.
How to use Power Standings?
fghfghdfhgdfhdfh
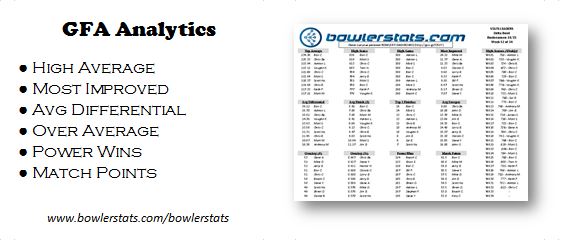
Average Differential – Average for the night versus the Field Average
Finishes – Top 1, Top 5, Top 10, Top 20 series for the week
Over Average – # of games bowled over average / % games bowled over average
High Games & Series – Top games and series for the season
Most Improvement – Bowler with the most improvement from 21 games
Rules & Details – League rules, formats, points, payouts, and other details.